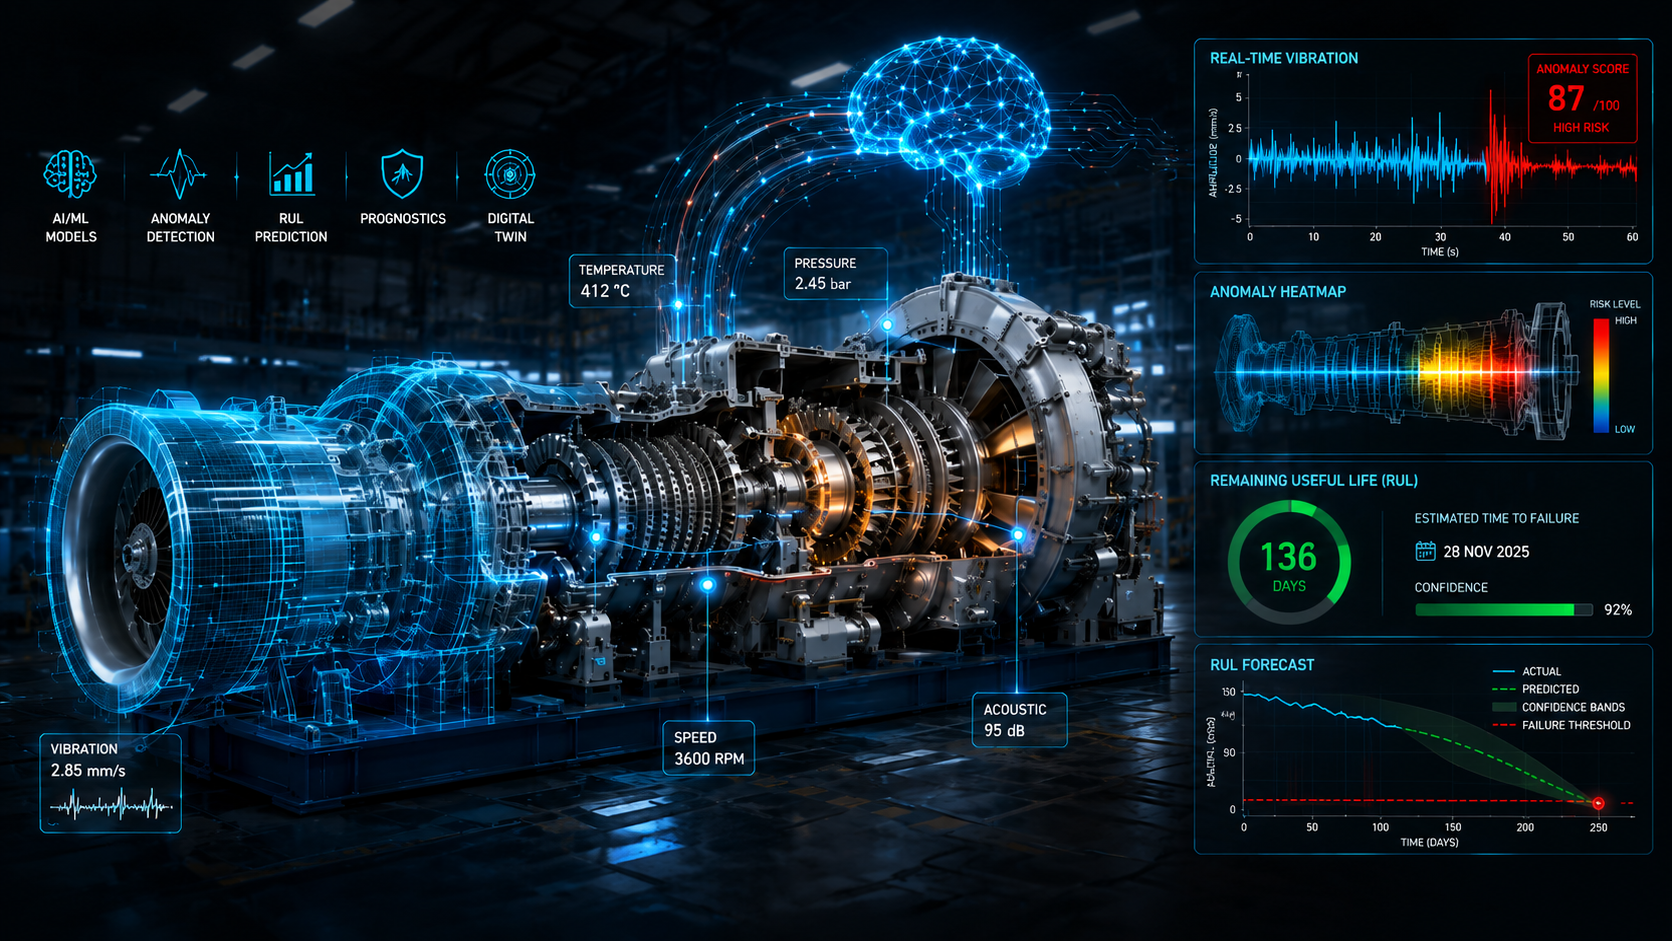
Early Warning System for Turbo Rotating Equipment
Anomaly detection and time-to-failure forecasting across 17 gas turbine engines on the AVEVA PI System
Introduction
Conventional fixed-threshold alarming provides a reliable but inherently reactive layer of protection: it notifies operators only at the moment a developing problem crosses a hard limit and forces a shutdown, and it is structurally unable to recognise the multivariate relationships that typically precede a failure. To close this gap, an Early Warning System was engineered and deployed across the full fleet of 17 Solar Turbine engines — comprising Gas Turbine Compressors (GTC) and Gas Turbine Generators (GTG) — to identify abnormal behaviour while every individual process variable still reads within its normal operating envelope, and to forecast the remaining time available before an operating limit is reached.
Benefit
By surfacing deviations well ahead of a hard alarm, the system converts what would otherwise be an unplanned emergency shutdown into a scheduled, planned intervention. Because the models are multivariate, abnormal behaviour is caught while every individual reading still sits comfortably inside its own limit—the kind of early deviation a single-tag alarm cannot see. Dedicated spike analysis distinguishes a degrading instrument from a genuinely degrading machine, preventing spurious nuisance trips and preserving operator trust in the system. Anomalies are aggregated at the subsystem level, so attention is directed to the fleet's true bad actor of the day rather than dispersed across 2,500 individual tags. Remaining running-hour estimates feed directly into inspection planning, and time-to-failure forecasts turn a raw warning into a concrete, plannable maintenance window measured in days rather than minutes.
Method — CRISP-DM
The project followed the CRISP-DM methodology end to end. Business Understanding fixed the two core deliverables — anomaly detection and forecast time-to-failure — each feeding directly into a mitigation plan,together with a running estimate of remaining hours to the next scheduled inspection. Data Understanding scoped the equipment population, defined the relevant tags and process parameters,and validated the PI Server historian as the authoritative data source. Data Preparation selected the most predictive variables and deliberately restricted the training window to periods of verified normal operation, so the models learned a genuine baseline rather than pre-existing faults. Modelling combined three complementary techniques — Random Forest, Prophet and LSTM — chosen for their respective strengths in classification, single-variable trend forecasting and sequence-based degradation prediction. The iterative Evaluation→Data Preparation loop was run through several cycles and was responsible for the majority of the accuracy gains realised over the course of the project.
System Architecture
Data flows from the field through a layered, production-grade architecture: PLC → PI Server→PI Asset Framework.The PI Web API serves as the integration gateway; Telegraf collects the required tags; InfluxDB provides interim time-series storage for the analytics layer; Python performs the model training and inference; SQL Server persists the resulting output; PI AF queries that output back into the historian context; PI Vision displays actual and predicted values side by side; and anomaly notifications are emailed automatically to the responsible maintenance team. Critically, the PI historian remains the single system of record throughout — model output is written back as native AF attributes, so every existing PI Vision display and downstream consumer picks it up unchanged, with no redevelopment required. Model training runs on a dedicated Windows server, while inference is deployed containerised on Linux for scalability and operational resilience.
Analysis
Two complementary analytical techniques are applied. Anomaly detection uses multivariable regression with a dedicated Random Forest model per subsystem,conditioned on current operating state and refreshed every five minutes; the resulting trend displays overlay the actual reading (white), the model's predicted value (green) and the operating limit (red), alongside a parallel spike count that isolates instrument health issues from genuine process deviation. Forecasting uses two further techniques matchedto the failure mode: Prophet models single-variable process upsets, such as lube oil header temperature trending towards its 165°F shutdown limit, while LSTM models longer-horizon degradation trajectories—for example bearing vibration (2X/2Y),trained on three months of history and forecasting 14 days ahead, validated to track the actual trend through to a subsequent real failure event.
Data Structure — Asset Framework
The PI Asset Framework hierarchy is structured in line with the ISO 14224 taxonomy: Site → Area → Engine → Subsystem, with a dedicated ML element nested inside each engine that holds one model per subsystem — seven models on a typical GTC. Standardised AF templates keep the fleet configuration uniform, so onboarding an additional engine is a configuration exercise rather than a new development effort. Model output is written tothe same AF element as the underlying process data, keeping context and results co- located. Because the subsystem is the fundamental unit of analysis, every detection arrives already routed to the specific maintenance discipline responsible for it, removing a manual triage step
Dashboard — Anomaly
Operators work through a four-level drill-down built natively in PI Vision: a fleet overview showing an AI/ML status lamp per engine; an engine-level view with colour-coded subsystem tiles carrying Total Daily Anomaly counts; a bad-actor ranking of individual tags within a selected subsystem; and, at the finest level, the three-line actual/predicted/limit trend. An Action Register is embedded in the same interface, so an operator can convert a detection directly into a recorded, owned action without ever leaving the display on which the anomaly was found. The complete set of operator wireframes for this workflow — fleet overview, engine summary, subsystem drill-down, anomaly matrix, daily review, tag- level detail and trend — is presented on the following pages.
Dashboard — Operator Wireframes
The PI Vision operator experience was designed and validated as a set of high-fidelity wireframes prior to build, covering the full workflow from fleet-level situational awareness down to individual tag trends: a Plant Overview summarising unit status across compressors and generators; an Engine Summary with live process and vibration readings; a Sub-Systems view ranking anomaly counts by discipline; an Anomaly Matrix cross- referencing every engine against every subsystem; a Daily Anomaly Review prioritising the worst-performing subsystems and open actions; a Combustion detail screen listing individual tag-level status; and an Axial Displacement trend showing actual, ML-predicted and six-sigma limit lines together. Full-resolution wireframes are provided on the following pages.
Dashboard Wireframes — AVEVA PI Vision
perator-facing screens validated ahead of build, from fleet overview down to individual tag trend.
Plant Overview
Fleet-level status across Gas Turbine Compressors, Gas Producers and Generators,with running/standby state and headline performance indicators per unit.
Engine Summary
Liveprocess,temperature,pressure and vibration readings for a selected engine, presented against its physicallay out for fast operator orientation.
Sub-Systems Drill-Down
Anomaly counts ranked by subsystem — GT Mechanical, Performance, Combustion, Seal Gas, Compressor Mechanical and Lube Oil — with 24-hour sparklines.
Anomaly Matrix
Every engine cross-referenced against every subsystem in a single heat-map, sized and coloured by 24-hour anomaly volume, for fleet-wide prioritisation.
Daily Anomaly Review
Shift-handover view ranking the worst six subsystems fleet-wide, a colour-coded fleet strip, and plant-level totals with open-action tracking.
Combustion — Tag Detail
Full tag list for a subsystem — process, fuel & power, and thermocouple groups — each with live status and a one-click trend shortcut.
Axial Displacement — Trend
Actual, ML-predicted and six-sigma limit lines overlaid on a single trend, the finest level of the drill-down used to validate a specific detection.